How to Read a FEMA Flood Map (FIRM)
A FEMA flood map, formally a Flood Insurance Rate Map (FIRM), is the official map on which FEMA has drawn a community’s Special Flood Hazard Areas and flood insurance risk zones (44 CFR 59.1). Lenders and local permit offices read the same map. To read one you need five things: which panel covers your property and its effective date, the flood zone you’re in, whether you’re in a floodway, and the base flood elevation where one is shown.
The quickest way to get the zone: look up your address. The result reads FEMA’s digital flood map, the National Flood Hazard Layer, and shows your zone, its subtype and the map ID. It shows a base flood elevation only where FEMA stores one for the whole zone, mostly on the coast; along rivers the elevation comes from the map itself (see step 4).
A Real FEMA Map, Annotated
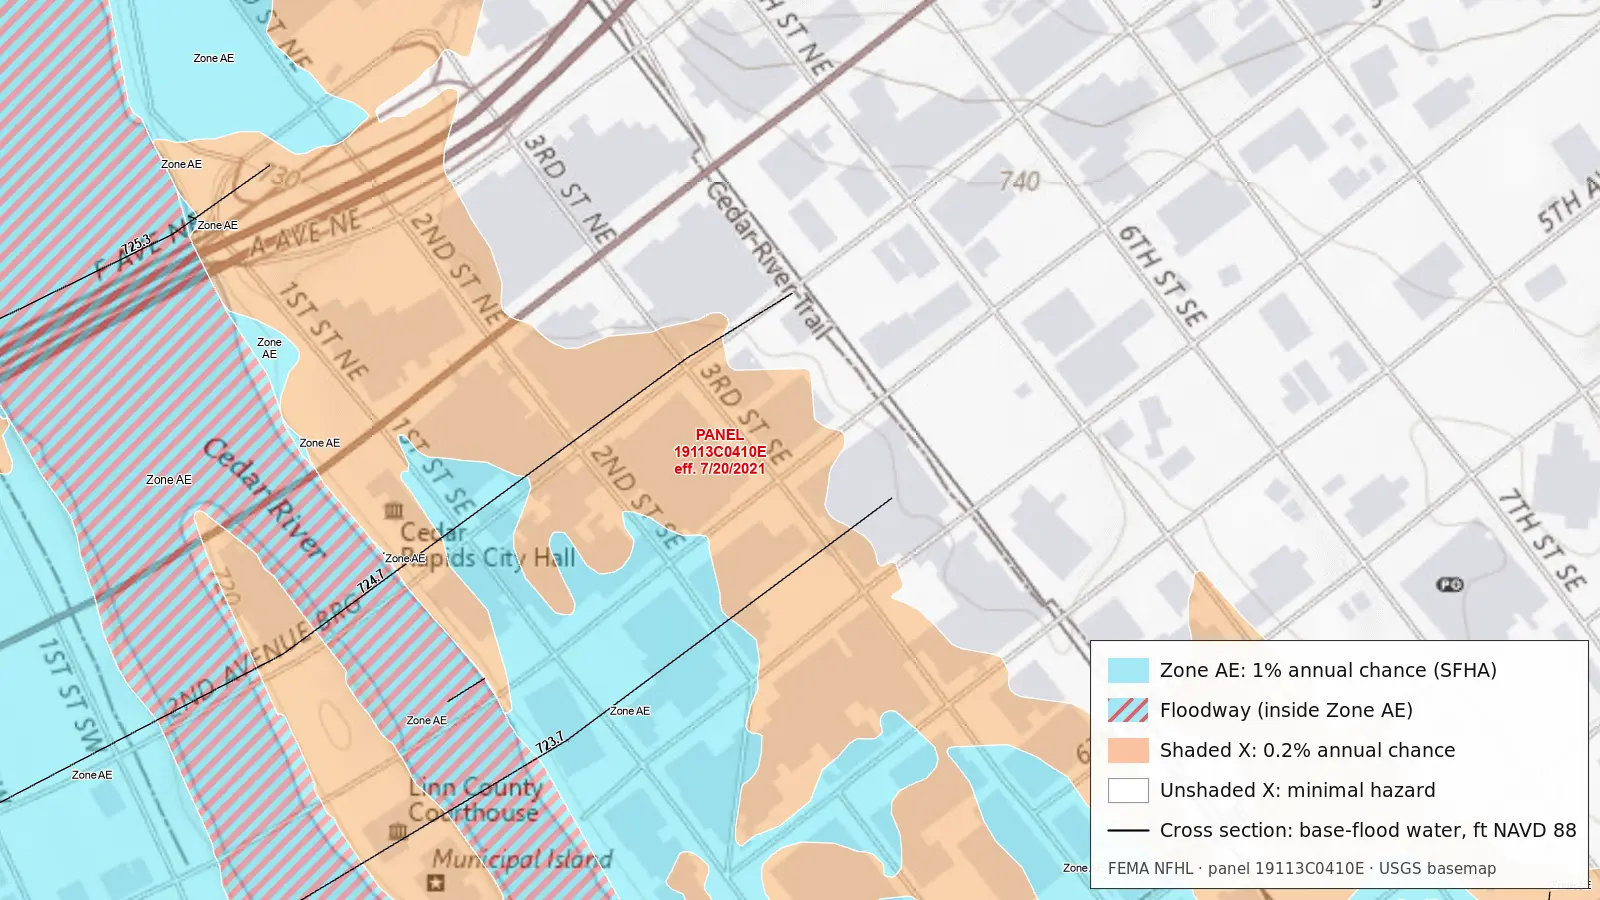
Everything on a flood map is in this one picture:
- Blue (Zone AE) is the Special Flood Hazard Area: land FEMA expects to flood in the base flood, the flood with a 1% chance of being equalled or exceeded in any year. Here it covers the river, both banks and a strip of streets east of City Hall.
- Red hatching (floodway) marks the river channel and the part of Zone AE kept open so the base flood can pass. It is still Zone AE; the hatching adds a floodway restriction on top.
- Orange (shaded Zone X) is, on this map, the 0.2%-annual-chance (“500-year”) floodplain: moderate risk, outside the Special Flood Hazard Area. On other maps shaded X also covers very shallow 1% flooding and areas behind levees.
- White (unshaded Zone X), mostly east of the Cedar River Trail, is FEMA’s “area of minimal flood hazard.”
- Black lines across the river are cross sections, the places where FEMA’s engineering study computed the flood. Their labels, 725.3 upstream to 723.7 downstream, are the base flood’s water-surface elevation there, in feet above the NAVD 88 datum.
Older printed panels show the same areas as tints and patterns rather than these colors; each panel’s legend gives the key. The zones themselves don’t change.
1. Find the Panel and Its Effective Date
Flood maps are printed as numbered panels, each covering a rectangle of a county or community. The panel number tells you what you’re looking at. The Cedar Rapids panel above is 19113C0410E:
- 19113: the state and county codes (19 is Iowa, 113 is Linn County)
- C: a countywide map, which usually covers every community in the county
- 0410: the panel number within that map
- E: the suffix. It usually advances when the panel is revised, so a later letter on the same panel number is normally the newer version.
Older maps made for a single community use the community’s six-digit NFIP community number in place of the county code. Every panel carries an effective date: the date that version became the official map. Panel 19113C0410E took effect on July 20, 2021. Lender flood-insurance requirements and most permit rules use the map in effect, not an older or proposed one, though a community can also apply newer flood data it holds. Check the scale too: this panel is drawn at 1:12,000, so one inch on the printed panel is 1,000 feet on the ground.
2. Read the Flood Zone
The letter on the map is the flood zone. They fall into three groups:
- High risk (Special Flood Hazard Area): zones beginning with A or V. Zone AE and Zone VE come with a base flood elevation; AH is shallow ponding (1 to 3 feet) and also has one; AO is shallow sheet flow, shown with an average depth; V zones are coastal areas with wave action. If a building in one of these zones secures a loan from a federally regulated lender or a federal agency lender, or a loan sold to Fannie Mae or Freddie Mac, flood insurance is required when the loan is made, increased, extended or renewed. Owners with no mortgage aren’t federally required to buy it. See What is a Special Flood Hazard Area?
- Moderate and minimal risk: Zone X, shaded or unshaded. Older maps call them Zone B and Zone C. No federal insurance requirement (a lender can still ask for it), but floods happen there too: in FEMA’s claims file since 1978, one in four NFIP claims came from Zone X and its older equivalents.
- Undetermined: Zone D, where FEMA has not studied the flood hazard. Insurance is available but not federally required.
If a zone line crosses your lot, it’s the building that counts, not the lot, and if any part of the building is in the high-risk zone the whole building counts as in it. The full list of zones explains each one.
3. Check for a Floodway
The regulatory floodway is the channel of a river plus the adjacent land that has to stay open so the base flood can pass without raising the water surface more than a set height (44 CFR 59.1), no more than one foot under FEMA’s standard. It matters more for building than for insurance. Once a floodway is mapped, the community must stop fill, new construction and substantial improvements in it unless an engineering analysis shows no increase in base-flood levels (44 CFR 60.3(d)(3)), or FEMA first approves a revision of the map (60.3(d)(4)).
So “Zone AE” and “Zone AE, floodway” are different answers, and the floodway can sit right beside lower-risk land: on Municipal Island in the Cedar Rapids map, the map goes from hatched floodway to shaded Zone X within a single block. Our lookup says so plainly when an address falls in a floodway.
4. Read the Base Flood Elevation
Along studied rivers, FEMA draws BFE lines (wavy lines on printed panels) across the floodplain, each labelled with the base flood’s water-surface elevation in whole feet. Where the elevation is the same over a wide area, as in parts of coastal Florida, the map prints one elevation for the whole zone instead.
- It’s an elevation, not a depth. On the Cedar Rapids map, the cross-section label 723.7 means the base flood reaches 723.7 feet above the NAVD 88 datum there, not 723 feet of water. To know how deep water would be at a building, compare the BFE with the building’s own surveyed elevation, which is what an Elevation Certificate records.
- Between two lines, the BFE at your spot lies between their values, and BFEs read off a map are only good to about half a foot. For an exact figure the community or a surveyor uses the flood profiles in the Flood Insurance Study, the engineering report behind the map.
- Check the datum. Newer maps use NAVD 88; many older ones use NGVD 29. Look up 1700 Convention Center Drive in Miami Beach and you’ll get Zone AE with a BFE of 8.0 feet in NGVD 29, from panel 12086C0317L, effective September 11, 2009. A survey in the other datum has to be converted before you compare numbers.
Lettered cross sections, like the three in the Cedar Rapids map, tie the map to those flood profiles and to the floodway tables in the Flood Insurance Study.
5. Make Sure It’s the Current Map
A printed panel can be out of date without looking it. Three things change the picture:
- Letters of Map Change. A Letter of Map Revision (LOMR) officially revises the map between reprints and comes with its own annotated map excerpt, so read the panel and its LOMRs together. A Letter of Map Amendment (LOMA) is FEMA’s determination that a specific property or building, on natural ground at or above the base flood elevation, is not in the high-risk zone. Neither changes the printed panel itself.
- Preliminary maps. If FEMA has issued new preliminary maps for your county, the zones may be about to change. Preliminary maps are posted at the Map Service Center, but the effective map governs until the new one takes effect.
- The digital layer. The National Flood Hazard Layer is built from the effective maps plus Letters of Map Change and is updated continuously, which is why our lookup reads from it. Updates lag a little, and LOMAs sit in their own layer, so a property with a recent LOMA can still read as high-risk in the zone result.
Where to Get the Official Map for Your Address
- Look up your address here for the zone, subtype, base flood elevation and map ID in a few seconds.
- Search the same address at FEMA’s Flood Map Service Center. It has the effective panel, Letters of Map Change for the area, and any preliminary maps, and can print a FIRMette, an official one-page excerpt of the panel around your property.
- Ask your community’s floodplain administrator, who keeps the maps and the Flood Insurance Study, and can tell you about local rules stricter than FEMA’s.
What the map can’t tell you: how likely your particular house is to flood. It’s a regulatory line drawn for one flood size, and many flood claims come from outside it. More in FEMA’s flood maps are a regulatory document, not a forecast.
Related: What is base flood elevation?, Zone A vs AE, Zone X shaded vs unshaded, What is a 100-year flood?
Sources: definitions from 44 CFR 59.1 and 60.3; map elements from FEMA’s “How to Read a Flood Insurance Rate Map” tutorial; mortgage rule from 42 U.S.C. 4012a; LOMR definition from 44 CFR 72.2; panel numbers, effective dates, zones and elevations from FEMA’s National Flood Hazard Layer (read October 24, 2026); basemap from the USGS National Map.
Check Your Property's Flood Zone
Free instant lookup using official FEMA data